DIY Charts Make Your Music, Pitches, Projects and Licensing Activity Spring to Life!
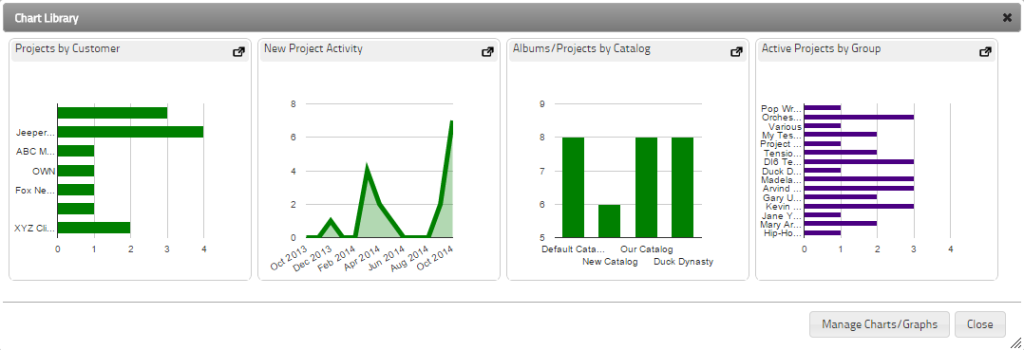
![]() If you’re a Magnetracks subscriber, you’ve already noticed the beautiful pie, bar and line graphs littered throughout the system and on your users’ dashboards. What many users do not realize however, is that you can create your own from scratch!
If you’re a Magnetracks subscriber, you’ve already noticed the beautiful pie, bar and line graphs littered throughout the system and on your users’ dashboards. What many users do not realize however, is that you can create your own from scratch!
Do you want to see a graph of all your license fees for the current year by the licensing customer? No problem. Do you want to see the trend in License Fees over time? Or a breakdown of Demo Submissions by Artist? How about a pie chart of your your Catalog Tracks by Genre? The possibilities are endless, and the insights are invaluable. Plus it’s fun!
How to Build Your Own Chart
All you need to do is visit SETUP > CHART LIBRARY > NEW CHART/GRAPH. From there you’ll be walked through a wizard-style chart building process that takes no more than 30 seconds, and you have a graph that can be instantly viewed when looking at a list of that type of record (catalog, license, artists, projects, tracks, etc.) and added to your dashboard if you like.
